
Collecting & Representing Data (Tallies & Picture Graphs)
MA1-DATA-01·DataA print-ready, no-prep Stage 1 (Years 1–2) data pack aligned to the NSW Mathematics K–10 Syllabus (2022), outcome MA1-DATA-01. Three differentiated worksheets — Support, Core and Extension — plus a real-world Apply It page and complete answer keys. Tally marks, picture graphs and a friendly maths buddy keep young learners engaged.
One-off price
$4.50AUD
Instant PDF download
Single-classroom licence
Secure checkout & instant delivery via Lemon Squeezy — connecting shortly.
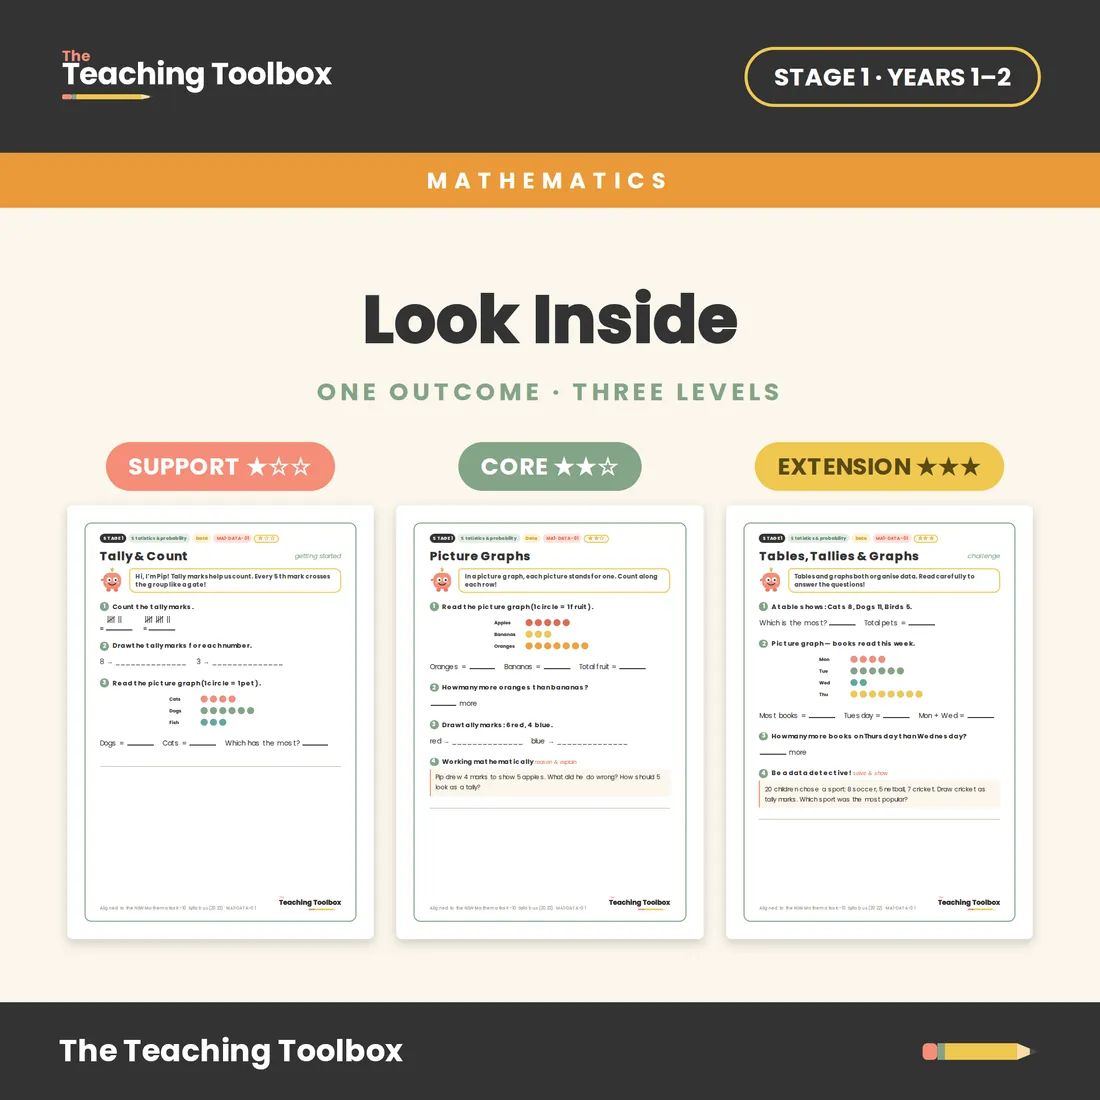
Three levels, one outcome
Every student works on MA1-DATA-01 — pitched to where they are.
Access the outcome with scaffolding
The grade-expected task
Stretch for those ready
What's included
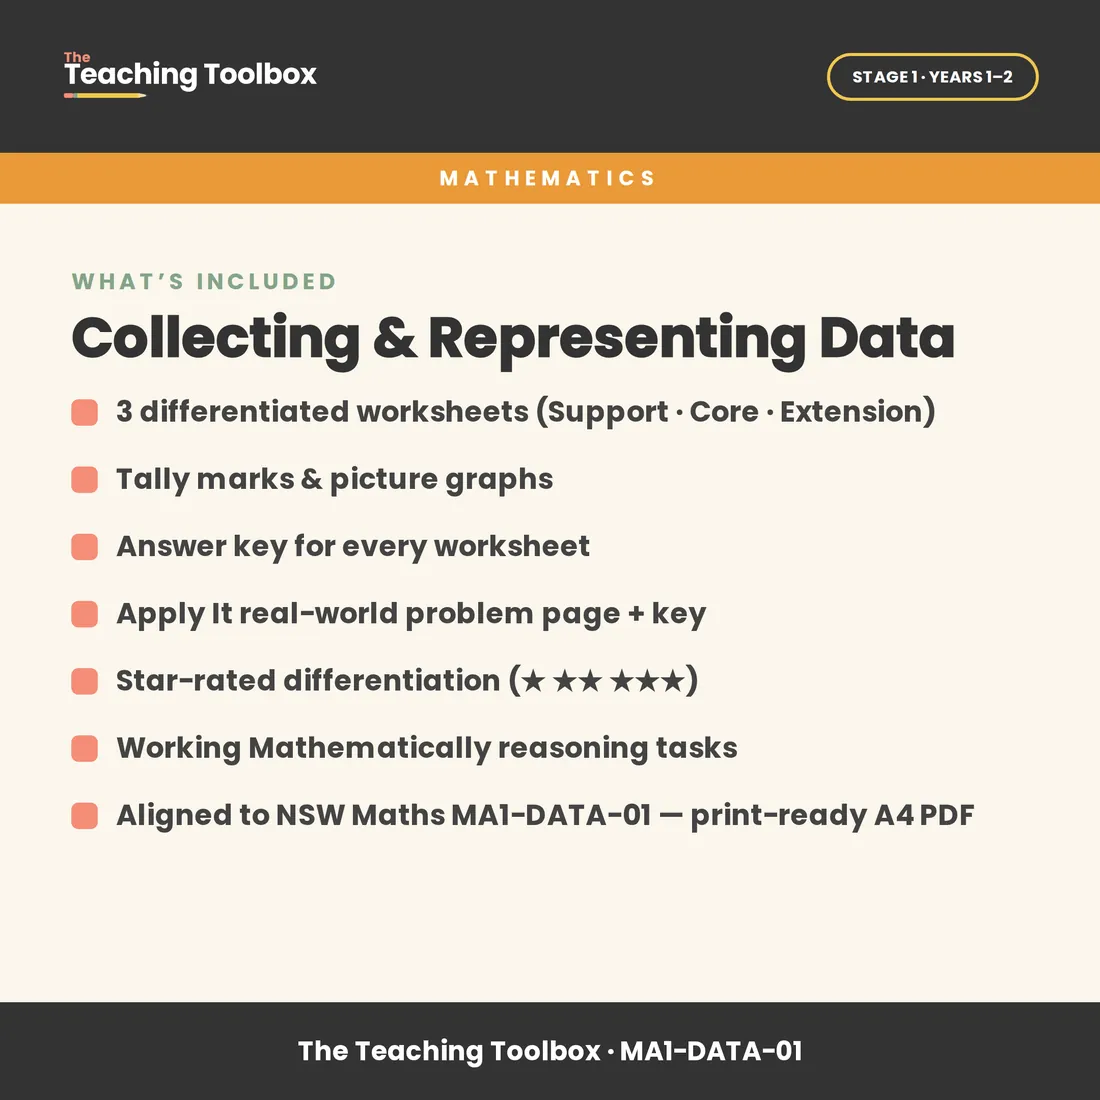
- Cover page
- Teacher / About page with syllabus alignment and a star-level legend
- Support worksheet (★) — count and draw tally marks, and read a picture graph
- Core worksheet (★★) — read a picture graph, compare and total, and draw tallies
- Extension worksheet (★★★) — tables and picture graphs, comparing, totalling and representing data
- A full answer key for every worksheet
- Apply It — real-world problems using tallies and picture graphs of pets and fruit
- Apply It answer key
Built on the evidence
This isn't a worksheet dump. Every choice in this pack is grounded in what the NSW Department of Education says actually helps students learn.
Explicit teaching & worked examples
The Teacher/About page sets the learning intention and models the outcome with worked examples before students practise — the NSW explicit-teaching sequence of I do → we do → you do.
CESE What Works Best 2025 · Explicit teaching
Differentiation that manages cognitive load
Three tiers — ★ Support, ★★ Core, ★★★ Extension — let you pitch each task to a student's prior knowledge, protecting novices from overload while stretching those ready for more.
CESE · Cognitive load theory
Application & transfer
An Apply It page takes the skill into a real-world context, helping students build durable, connected schemas rather than isolated procedures.
NSW DoE · How learning happens
Syllabus-aligned & assessable
Mapped directly to NSW Mathematics K–10 (2022) outcome MA1-DATA-01, with a full answer key for every task so you can check for understanding at a glance.
NESA · NSW Mathematics K–10 (2022)
Save with a bundle
CC BY 4.0 · Syllabus outcomes © NESA 2022